
Comparing KUSANAGI Environment with LAMP Environment
Now, let’s start by preparing a KUSANAGI environment and a CentOS 7 LAMP environment so we can benchmark test the WordPress front page to better understand the numbers. We will be looking at two specific things when we bench mark.
The first thing we will measure is how many milliseconds it takes for the HTML to be returned by the server once you access WordPress with a browser. This is called the "page load time". You need a developer tool to measure this with your browser. In this column we will be using the Firefox addon Firebug.
The other thing we will measure, with the tool Apache Bench (ab), is how many times per second the virtual machine can access itself. This is called "requests per second".
Launch a KUSANAGI Environment and Bench Mark
For the KUSANAGI environment, refer to the following page and select the cloud platform you wish to use.
Keep in mind that for maximum performance KUSANAGI requires an instance with at least 3.5GB of memory, but for testing purposes you only need 2GB. For this column, we want to show the most standard benchmark results, so we will be using a D1_V2 Standard instance on Microsoft Azure (single-core CPU, 3.5GB memory) with the region set to Japan East. This instance favors CPU performance for about 8000 yen a month. An hour of usage is 11 yen, so for the four hours of real-time practice, you will spend about 44 yen. What a time to be alive. If you are using a different environment, please adjust accordingly.
Now let's launch KUSANAGI. Use the following page to launch KUSANAGI, connect via SSH, and switch to root user. Remember to choose a D1_V2 Standard instance in the Japan East region.
Next, you can set the name resolution with the host name (public DNS) and access the virtual machine from the host. You may also use a hosts file on the client machine to set up name resolution. We will be using the host name xxx.xxx.cloudapp.azure.com.
Once you are the root user, perform initialization using the following page. From here on the contents will be the same no matter what cloud platform you decided to use.
Once you have initialized KUSANAGI, refer to the following document to provision WordPress by creating the necessary directories and configuring files for installation. In the hostname setting, use the address (xxx.xxx.cloudapp.azure.com) to allow access to the virtual machine from the host. We will not be installing Let's Encrypt, so to skip that step, hit Enter twice to continue.
Once provisioning is finished, install WordPress.
When the WordPress installation is complete, return to the console to confirm the status of KUSANAGI.
[root@codezin-kusanagi ~]# kusanagi status
The following status will be displayed:
● nginx.service - nginx - high performance web server
   Loaded: loaded (/usr/lib/systemd/system/nginx.service; enabled; vendor preset: disabled)
   Active: active (running) since Mon 2016-03-14 21:28:11 JST; 32min ago

● httpd.service - The Apache HTTP Server
   Loaded: loaded (/usr/lib/systemd/system/httpd.service; disabled; vendor preset: disabled)
   Active: inactive (dead)

● hhvm.service - HHVM virtual machine, runtime, and JIT for the PHP language
   Loaded: loaded (/etc/systemd/system/hhvm.service; enabled; vendor preset: disabled)
   Active: active (running) since Mon 2016-03-14 21:28:19 JST; 32min ago

● php-fpm.service - The PHP FastCGI Process Manager
   Loaded: loaded (/usr/lib/systemd/system/php-fpm.service; disabled; vendor preset: disabled)
   Active: inactive (dead)

● php7-fpm.service - The PHP FastCGI Process Manager
   Loaded: loaded (/usr/lib/systemd/system/php7-fpm.service; disabled; vendor preset: disabled)
   Active: inactive (dead)

fcache off
bcache off
The "kusanagi status" command displays the status of the web servers, PHP processors, and caches. When you first launch KUSANAGI, it should be configured as Nginx+HHVM. "fcache off" shows that Nginx's FastCGI cache is disabled, and "bcache off" shows that the specialized KUSANAGI plugin for page caching is also disabled. If you have any questions regarding KUSANAGI commands, please check the following page.
Now let's bench mark. First, we will test the configuration Apache 2.4+PHP 5.6. You can use KUSANAGI commands to change middleware. "kusanagi httpd" will enable Apache 2.4, and "kusanagi php-fpm" will enable PHP 5.6.
[root@codezin-kusanagi ~]# kusanagi httpd
[root@codezin-kusanagi ~]# kusanagi php-fpm
With this done, you can take a benchmark using the ab command.
[root@codezine-kusanagi ~]# ab -n 100 -c 10 http://xxx.xxx.cloudapp.azure.com/
The following results will be displayed.
This is ApacheBench, Version 2.3 <$Revision: 1706008 $>
Copyright 1996 Adam Twiss, Zeus Technology Ltd, http://www.zeustech.net/
Licensed to The Apache Software Foundation, http://www.apache.org/

Benchmarking codezine-kusanagi.japaneast.cloudapp.azure.com (be patient).....done


Server Software:        Apache
Server Hostname:        codezine-kusanagi.japaneast.cloudapp.azure.com
Server Port:            80

Document Path:          /
Document Length:        10946 bytes

Concurrency Level:      10
Time taken for tests:   3.232 seconds
Complete requests:      100
Failed requests:        0
Total transferred:      1124500 bytes
HTML transferred:       1094600 bytes
Requests per second:    30.94 [#/sec] (mean)
Time per request:       323.199 [ms] (mean)
Time per request:       32.320 [ms] (mean, across all concurrent requests)
Transfer rate:          339.77 [Kbytes/sec] received

Connection Times (ms)
              min  mean[+/-sd] median   max
Connect:        0    0   0.0      0       0
Processing:   129  318  52.0    309     555
Waiting:      129  317  47.6    309     459
Total:        129  318  52.0    309     555

Percentage of the requests served within a certain time (ms)
  50%    309
  66%    323
  75%    338
  80%    352
  90%    375
  95%    406
  98%    460
  99%    555
 100%    555 (longest request)
Perform the test five times, with an interval of 10 seconds between tests. In our environment, our fifth test wielded 30.94 for requests per second.
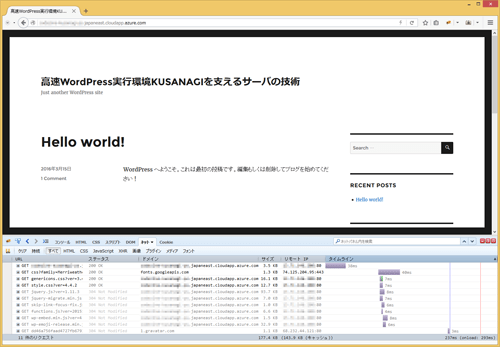
Also measure the page load time. Go to the front page of WordPress, and use Firebug. In the next tab, the top line will show your results. We got 38ms.
Continue benchmarking with different configurations.
For Apache 2.4+PHP 7, enter the following command.
[root@codezine-kusanagi ~]# kusanagi php7
Bench mark with ab and Firebug. Our requests per second was 76.76 and our page load time was 20ms.
For Apache 2.4+HHVM 3.2, enter the following command.
[root@codezine-kusanagi ~]# kusanagi hhvm
Bench mark with ab and Firebug. Our requests per second was 92.42 and our page load time was 16ms. HHVM requires time to warm up, so perform the test at least eight times. We will explain the details in a later article, but this has to do with the way HHVM generates byte-code and compiles.
Next we will switch web servers. To switch to Nginx, enter the following command.
[root@codezine-kusanagi ~]# kusanagi nginx
We got the following results with the various PHP processors.
- PHP 5.6 31.24/s 38ms
- PHP 7 80.05/s 17ms
- HHVM 3.12 97.74/s 15ms
Page load time also depends on network availability, so there will be some difference, but Nginx will produce several percent better performance than Apache.
Although it will be meaningless to compare with the LAMP environment, next we will enable caching and take a benchmark.
With the following command, enable the specialized page caching WordPress plugin for KUSANAGI.
[root@codezine-kusanagi ~]# kusanagi bcache on
Switch to PHP 7 to perform the benchmark.
[root@codezine-kusanagi ~]# kusanagi php7
With page caching enabled, if the requests are too few, results will be inconsistent, so change the ab command to 10000 requests at 100 concurrent requests.
[root@codezine-kusanagi ~]# ab -n 10000 -c 100 http://xxx.xxx.cloudapp.azure.com/
In our environment, requests per second was 1530.14 and our page load time was 7ms.
Finally, use the following command to enable Nginx's FastCGI cache and take a benchmark.
[root@codezine-kusanagi ~]# kusanagi fcache on
In our environment, requests per second was 14942.95 and our page load time was unmeasurable.

