
Measure page load time
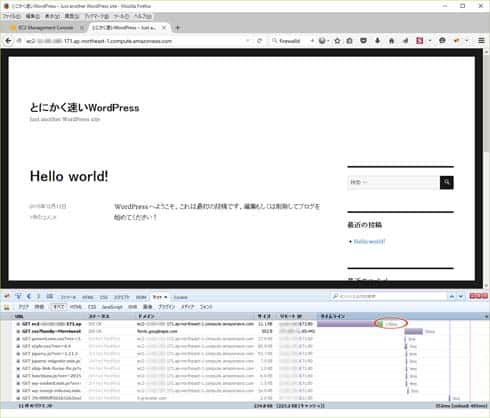
Next, you will measure the page load time. You can use the Firefox addon Firebug or other development tool to see the load time. Refresh and note the time. In my example, the time was 176ms.
Return to the terminal and use the ab command to perform a benchmark test. Enter the following to test your front page using 100 requests and 10 concurrent requests.
[root@ip www]# ab -n 100 -c 10 http://ec2-xxx.xxx.compute.amazonaws.com/
The following result data will appear:
This is ApacheBench, Version 2.3 <$Revision: 1430300 $>
Copyright 1996 Adam Twiss, Zeus Technology Ltd, http://www.zeustech.net/
Licensed to The Apache Software Foundation, http://www.apache.org/
Benchmarking ec2-xxx.xxx.compute.amazonaws.com (be patient).....done
Server Software:        Apache/2.4.6
Server Hostname:        ec2-xxx.xxx.compute.amazonaws.com
Server Port:            80
Document Path:          /Document Length:        11373 bytes
Concurrency Level:      10
Time taken for tests:   8.894 seconds
Complete requests:      100
Failed requests:        0
Write errors:           0
Total transferred:      1166200 bytes
HTML transferred:       1137300 bytes
Requests per second:    11.24 [#/sec] (mean)
Time per request:       889.361 [ms] (mean)
Time per request:       88.936 [ms] (mean, across all concurrent requests)
Transfer rate:          128.05 [Kbytes/sec] received
Connection Times (ms)
              min  mean[+/-sd] median   max
Connect:        0    0   0.1      0       0
Processing:   449  876  70.2    879    1004
Waiting:      437  842  67.2    849     974
Total:        449  876  70.2    879    1004
Percentage of the requests served within a certain time (ms)
  50%    879
  66%    909
  75%    920
  80%    930
  90%    951
  95%    976
  98%    991
  99%   1004
 100%   1004 (longest request)
Requests per second is how many concurrent requests were processed in one second. In my case it was 11.24.
You can estimate this amount. Since the instance uses a dual-core CPU, if you divide 1000ms by 176ms and multiply by 2 you will get 11.36, very close to 11.24. As you can see, page load time and requests per second are inversely related.

